Zoho Analytics for Business Owners: Dashboards That Actually Drive Decisions
Most analytics dashboards show data nobody acts on. Here's how to configure Zoho Analytics with the 5 dashboards business owners actually use to make decisions.
Most business owners have too many reports and not enough answers. The CRM has its reports. The accounting system has its reports. Inventory has its reports. Each one shows a slice of the business. None of them show the full picture.
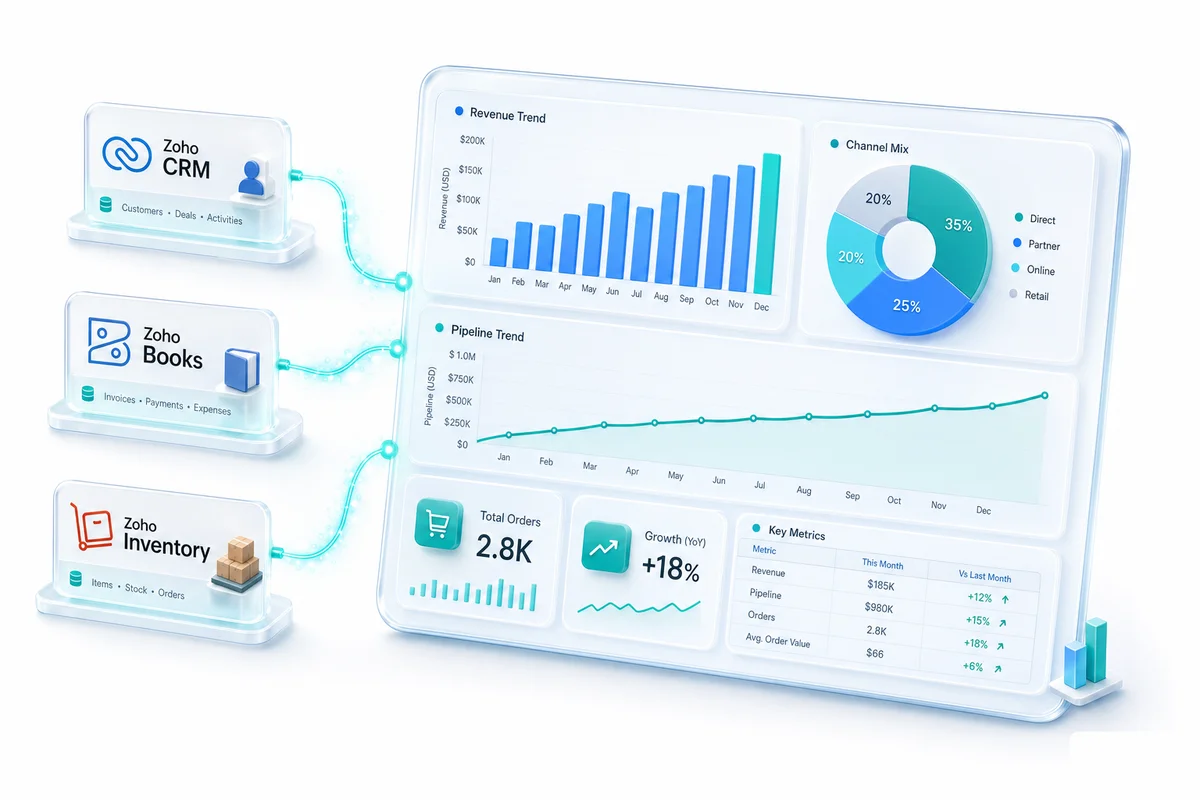
Zoho Analytics solves this by pulling data from all your Zoho apps (and external sources) into unified dashboards. But the tool is only as useful as the dashboards you build. And most implementations either create too many charts (dashboard clutter) or the wrong charts (vanity metrics that look good but don't drive action).
Here are the 5 dashboards we configure for business owners across our implementations. Each one answers a specific question that directly affects decisions.
Dashboard 1: Revenue and financial health
Question it answers: "How's the business doing financially, right now?"
This dashboard pulls from Zoho Books and shows:
Revenue trend. Monthly revenue for the last 12 months with year-over-year comparison. Not just total revenue, but broken down by product line, service type, or channel. For eCommerce businesses, this means revenue per marketplace (Shopify, Amazon, WooCommerce, eBay).
Gross margin. Revenue minus COGS, shown as a percentage trending over time. A declining margin trend is the earliest warning sign of pricing or cost problems. Most business owners only see this at quarterly reviews with their accountant.
Accounts receivable aging. Open invoices grouped by 0-30 days, 31-60 days, 61-90 days, 90+ days. When the 90+ bucket grows, cash flow problems follow 2-3 months later. Seeing it in real time lets you act before it hurts.
Cash flow forecast. Expected inflows (outstanding invoices by due date) minus expected outflows (upcoming bills, recurring expenses). A 30-60 day forward view that tells you whether you need to collect faster, delay purchases, or tap a credit line.
Monthly close status. For businesses using our managed accounting service, a visual tracker showing which reconciliation steps are complete for the current month.
This dashboard replaces the monthly P&L that arrives 2-3 weeks after month-end. The data's the same, but it's current, not historical.
Dashboard 2: Sales pipeline and forecast
Question it answers: "What's coming in, and can I trust the forecast?"
Pulls from Zoho CRM:
Pipeline by stage. Total deal value at each pipeline stage, colour-coded by health. Deals that have been in a stage too long get flagged. A healthy pipeline has a consistent flow through stages; a bottleneck at "Proposal Sent" means something's wrong with your proposals or pricing.
Weighted forecast. Deal values multiplied by stage probability, giving a realistic expected revenue for the next 30/60/90 days. This is the number you use for hiring decisions, inventory purchases, and cash flow planning, not the "total pipeline" number that includes every optimistic deal.
Win rate trends. Monthly win rate (closed won / total closed) over the last 12 months. A declining win rate demands investigation. Combined with close reason data, you'll see whether you're losing on price, features, timing, or competition.
Sales velocity. Average days from lead creation to deal close. This metric tells you how long your sales cycle actually is, not how long you think it is. If velocity is increasing, deals are getting harder to close.
Rep activity and performance. Calls, emails, meetings, and deals per rep. Not for micromanagement, but for identifying who needs support and who has capacity for more leads.
Dashboard 3: Inventory and operations (eCommerce)
Question it answers: "Am I going to stock out, overstock, or miss a fulfillment?"
Pulls from Zoho Inventory and connects with inventory management solutions:
Stock levels by SKU. Current quantity, reorder point, days of supply remaining. SKUs approaching reorder point get flagged. SKUs with 90+ days of supply get flagged differently; that's tied-up capital.
Channel-by-channel inventory. For multi-channel sellers, see stock allocated per channel (Shopify, Amazon FBA, warehouse) and total available. Prevents the "sold out on Amazon but 200 units sitting in Shopify" problem.
Fulfillment rate. Percentage of orders shipped within SLA (same day, next day, whatever your commitment is). When this drops below 95%, customer satisfaction follows. The dashboard shows the trend and identifies the bottleneck (out of stock, warehouse delay, carrier issue).
Inventory turnover. How fast you're selling through stock, by SKU and by category. Low turnover SKUs are candidates for clearance or discontinuation. High turnover SKUs need more aggressive reorder quantities.
Dashboard 4: Customer support health
Question it answers: "Are our customers happy, and where are they struggling?"
Pulls from Zoho Desk and CRM:
Ticket volume trend. Total support tickets over time, by category. A spike in tickets about the same topic signals a product issue, a documentation gap, or an onboarding problem.
Resolution time. Average time from ticket creation to resolution, by priority and by agent. When resolution time creeps up, it means your team is overloaded or the issues are getting more complex.
Customer satisfaction (CSAT). Post-ticket satisfaction scores, trended over time. This is the clearest signal of whether your support is working.
Tickets by account tier. Connected to CRM data, this shows whether your highest-value customers are getting the fastest resolution. If your biggest accounts have the longest wait times, that's a retention risk.
This dashboard is especially useful for businesses running integrated customer support and CRM setups.
Dashboard 5: Team productivity and utilisation
Question it answers: "Is the team working on the right things, and do we have enough capacity?"
Pulls from Zoho Projects and CRM:
Billable utilisation. For professional services firms: billable hours as a percentage of total available hours per team member. Target varies by role (consultants: 65-75%, managers: 50-60%, principals: 30-40%), but the dashboard shows actual versus target.
Project margin. Revenue per project minus the fully-loaded cost of hours delivered. Shows which projects are profitable and which are eating margin. For construction and consulting firms, this is the core profitability metric.
Task completion rate. Percentage of tasks completed on time versus overdue, by team and by project. Consistent overdue tasks indicate scope creep, poor estimation, or resource constraints.
Capacity forecast. Committed hours for the next 2-4 weeks versus available capacity. Shows whether you can take on new work or need to hire/subcontract.
How to set these up
Zoho Analytics' drag-and-drop interface handles most of these dashboards without code. The process:
- Connect data sources. Link Zoho CRM, Books, Inventory, Desk, and Projects (one-click native connections).
- Define relationships. Map how data tables connect (CRM Contacts → Books Invoices → Desk Tickets). Zoho auto-detects most relationships.
- Build widgets. Drag fields onto chart builders. Choose visualisation type (line chart for trends, bar chart for comparisons, KPI widget for single numbers).
- Set refresh schedule. Data syncs hourly or daily depending on the source. Real-time dashboards are available for CRM data.
- Share and embed. Dashboard links for team members, email schedules for leadership, embedded views for client portals.
For complex cross-source queries (like calculating project profitability by combining Projects time data with Books revenue data), you'll need calculated fields or SQL queries. Our implementation team handles this during setup.
The mistake to avoid: too many dashboards
The goal isn't to visualise every data point you have. It's to answer the 5-10 questions that drive your most important decisions. Every chart on a dashboard should prompt an action: investigate, adjust, celebrate, or escalate.
If you find yourself scrolling past charts, those charts shouldn't be there.
Start with the 5 dashboards above. Add more only when a specific, recurring decision needs data you don't have yet. For eCommerce teams who need the specific KPI calculations — CAC by channel, LTV by cohort, COGS%, and contribution margin — rather than the general dashboard setup, see the Zoho Analytics eCommerce reporting guide: it covers the specific eCommerce data model joins, formula logic, and dashboard tiles that translate Zoho Finance data into unit economics.
Book a free consultation and we'll scope the analytics setup that matches your business.
Frequently Asked Questions
Yes. Zoho Analytics has native connectors to Zoho CRM, Books, Inventory, Desk, Projects, Campaigns, and most other Zoho apps. Data syncs automatically on a schedule you define (hourly, daily, or real-time for some connectors). It also connects to external sources like Google Sheets, Shopify, databases, and third-party apps via API.
Zoho Analytics Basic starts at $30/month for 2 users with 0.5 million data rows. Professional is $60/month for 5 users with 1 million rows. Premium is $145/month for 15 users with 5 million rows. Enterprise is $575/month for 50 users with 50 million rows. Zoho Analytics is also included in Zoho One at $45/user/month.
Yes. Zoho Analytics supports public embed links, password-protected sharing, and embedded dashboards in web pages. You can also email scheduled reports as PDFs to anyone. Client-facing dashboards can be embedded in your client portal without requiring the recipient to have a Zoho license.
No for basic dashboards; the drag-and-drop interface handles standard charts, tables, and KPI widgets. Moderate SQL knowledge helps for complex cross-source queries and calculated fields. Zoho's formula language covers most calculated metrics without SQL. For complex data transformations, Zoho Analytics supports SQL queries directly.
Zoho CRM's built-in reports work well for CRM-specific data (pipeline, deals, activities). Zoho Analytics combines data from multiple sources (CRM, Books, Inventory, Desk, Projects, and external systems) into unified dashboards. If you need cross-department visibility (sales + finance + operations in one view), that's where Analytics adds value.
See exactly where your Shopify, Amazon, or WooCommerce ops are leaking — free.
Get a personalised eCommerce Ops Audit: inventory gaps, accounting leaks, and order-flow bottlenecks — with a Zoho fix roadmap. Delivered in 48 hours, at no cost.